AHA 2026: 20 new models, and p(doom) turns up
2026-10-24
Today the 2026 AHA leaderboard grew from 40 to 60 distinct models. The new batch is the largest single-day addition so far. On average it scored slightly worse than the models already on the board, and that was enough to flip the board's 2026 trend: p(doom) moved from 0.177 to 0.191.
AHA Score is the share of comparisons where a model's answer agrees with the ground-truth sessions. It is a human alignment measure.
Results
Top of the new batch by AHA Score:
| Model | AHA Score | Matches |
|---|---|---|
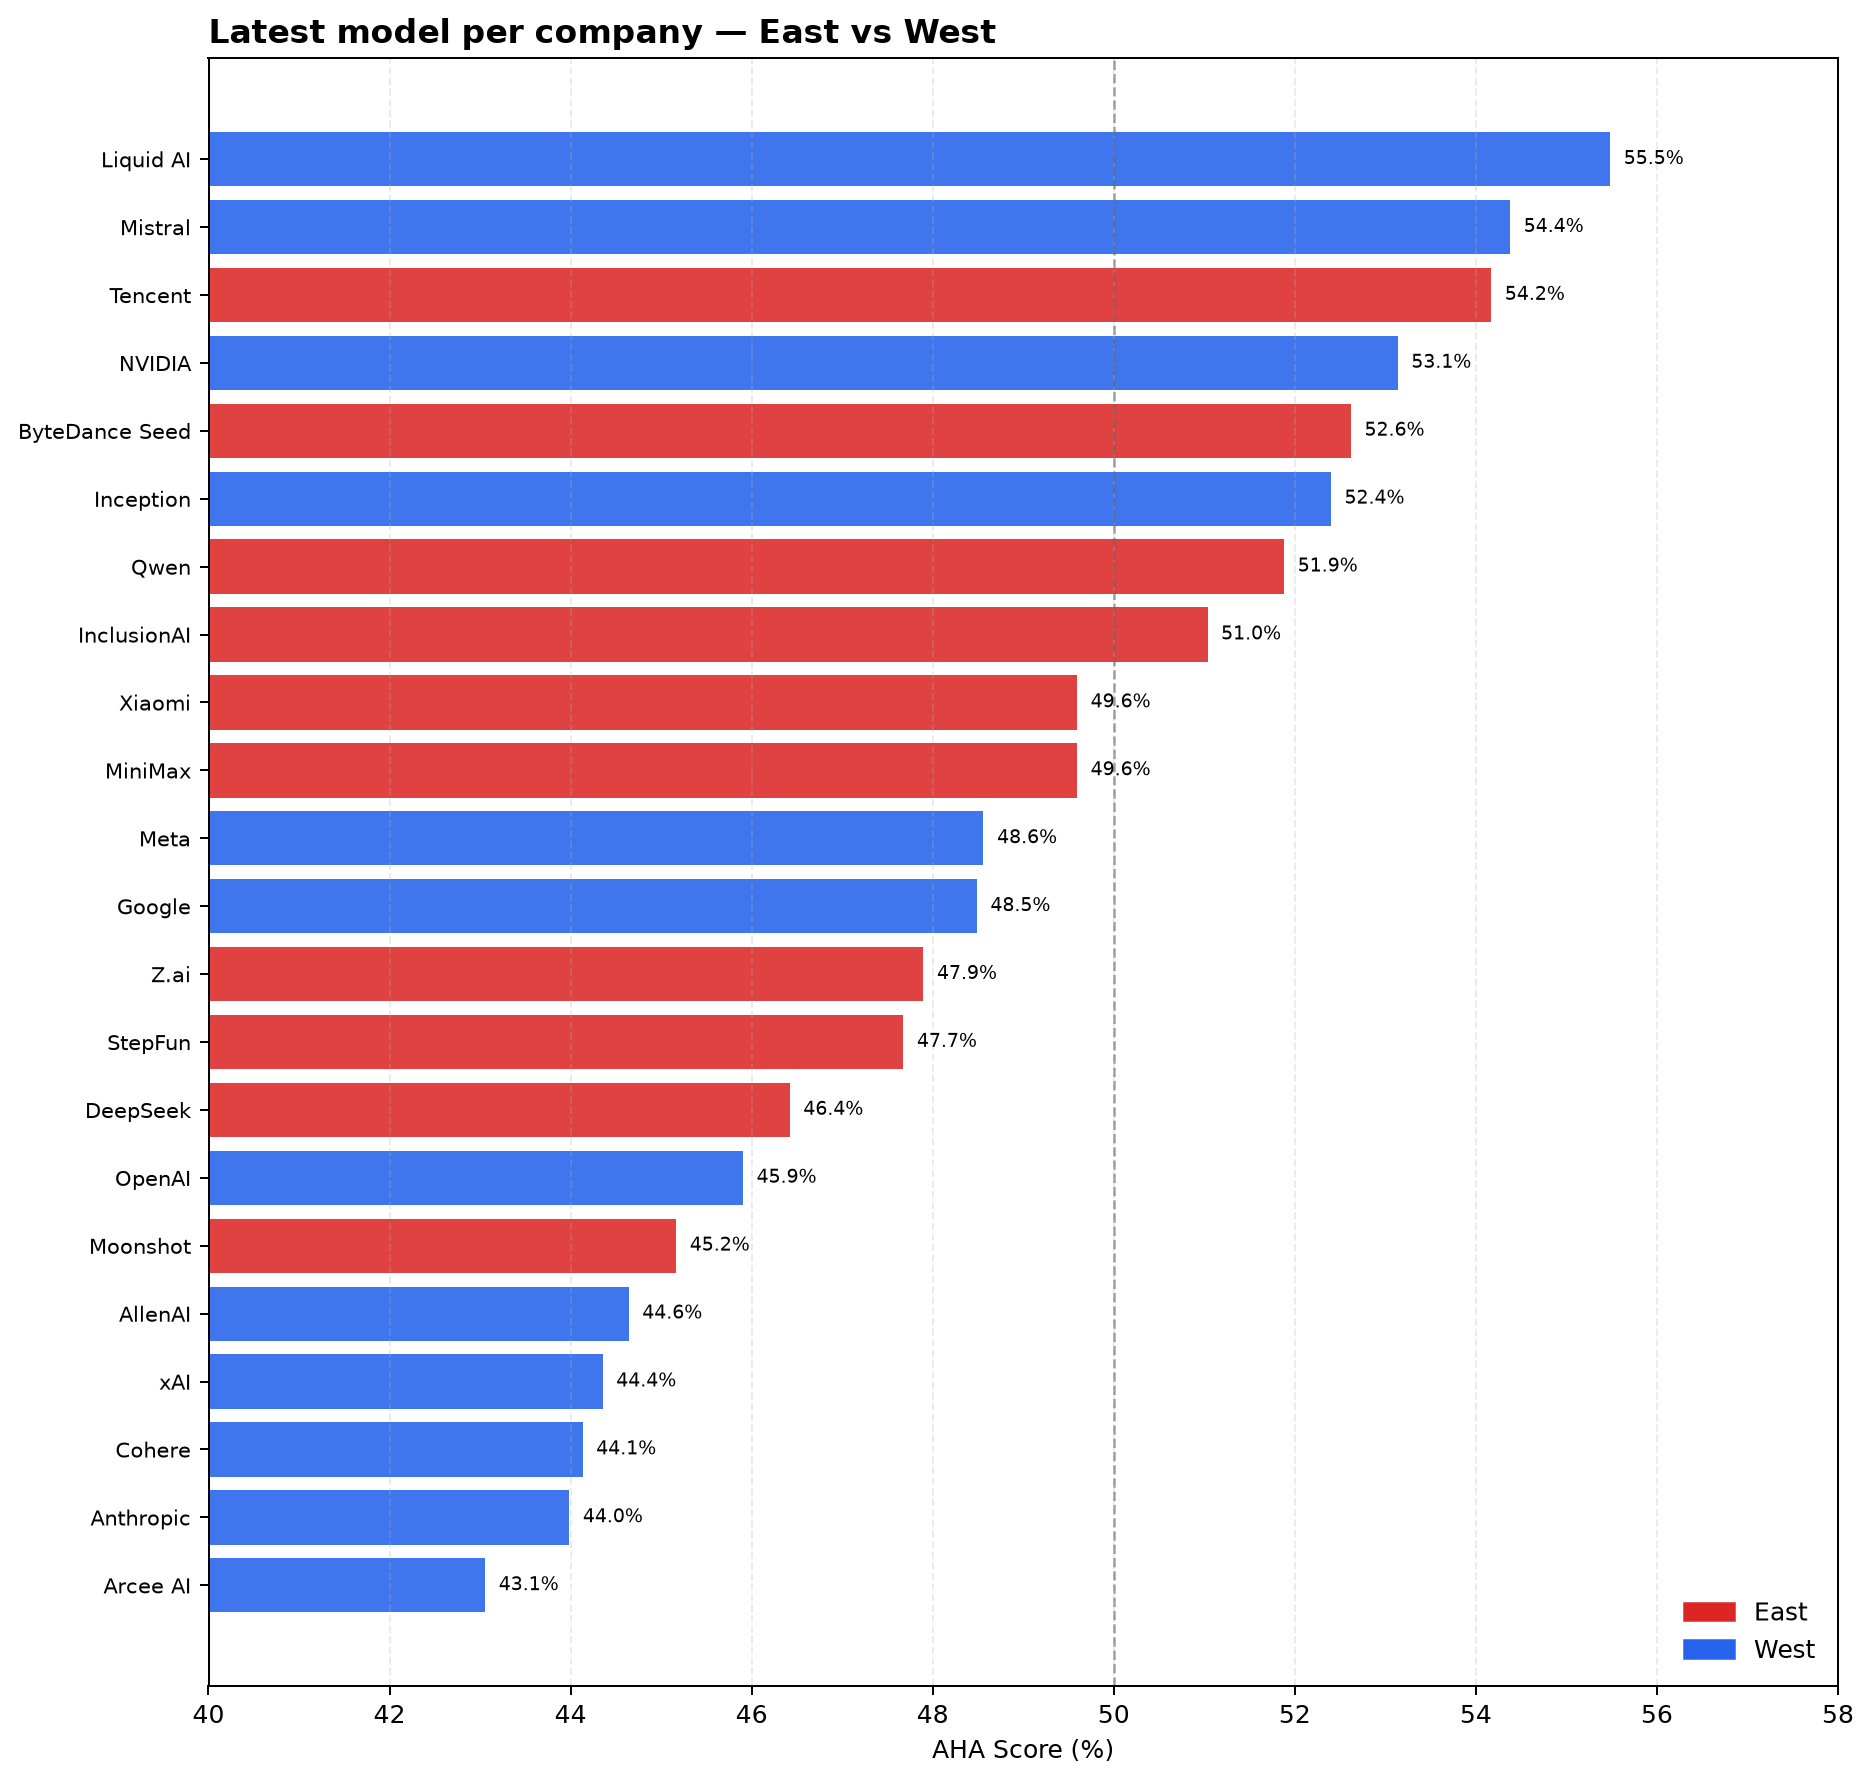
| tencent/hy4-preview | 54.2% | 734 / 1355 |
| nvidia/nemotron-3.5-super-vl | 53.1% | 720 / 1355 |
| bytedance-seed/seed-2-1-turbo | 52.6% | 713 / 1355 |
| inception/mercury-3 | 52.4% | 710 / 1355 |
| qwen/qwen3.8-max-0902 | 51.9% | 703 / 1355 |
| inclusionai/ling-3.1-flash | 51.0% | 690 / 1352 |
| minimax/minimax-m3.1-flash | 49.6% | 672 / 1355 |
| xiaomi/mimo-v2.6-pro | 49.6% | 672 / 1355 |
| meta/muse-wonder | 48.6% | 658 / 1355 |
| google/gemini-4-argon | 48.5% | 657 / 1355 |
The premium models did not lead on this benchmark. Claude Opus 5.5 scored 44.0%, Grok 4.7 scored 44.4%, and GPT-6 Astra scored 44.6%. That is consistent with a pattern already visible in 2026: newer, more cautious models often agree less with the binary ground truth than the models they replace.
Intra-company trends
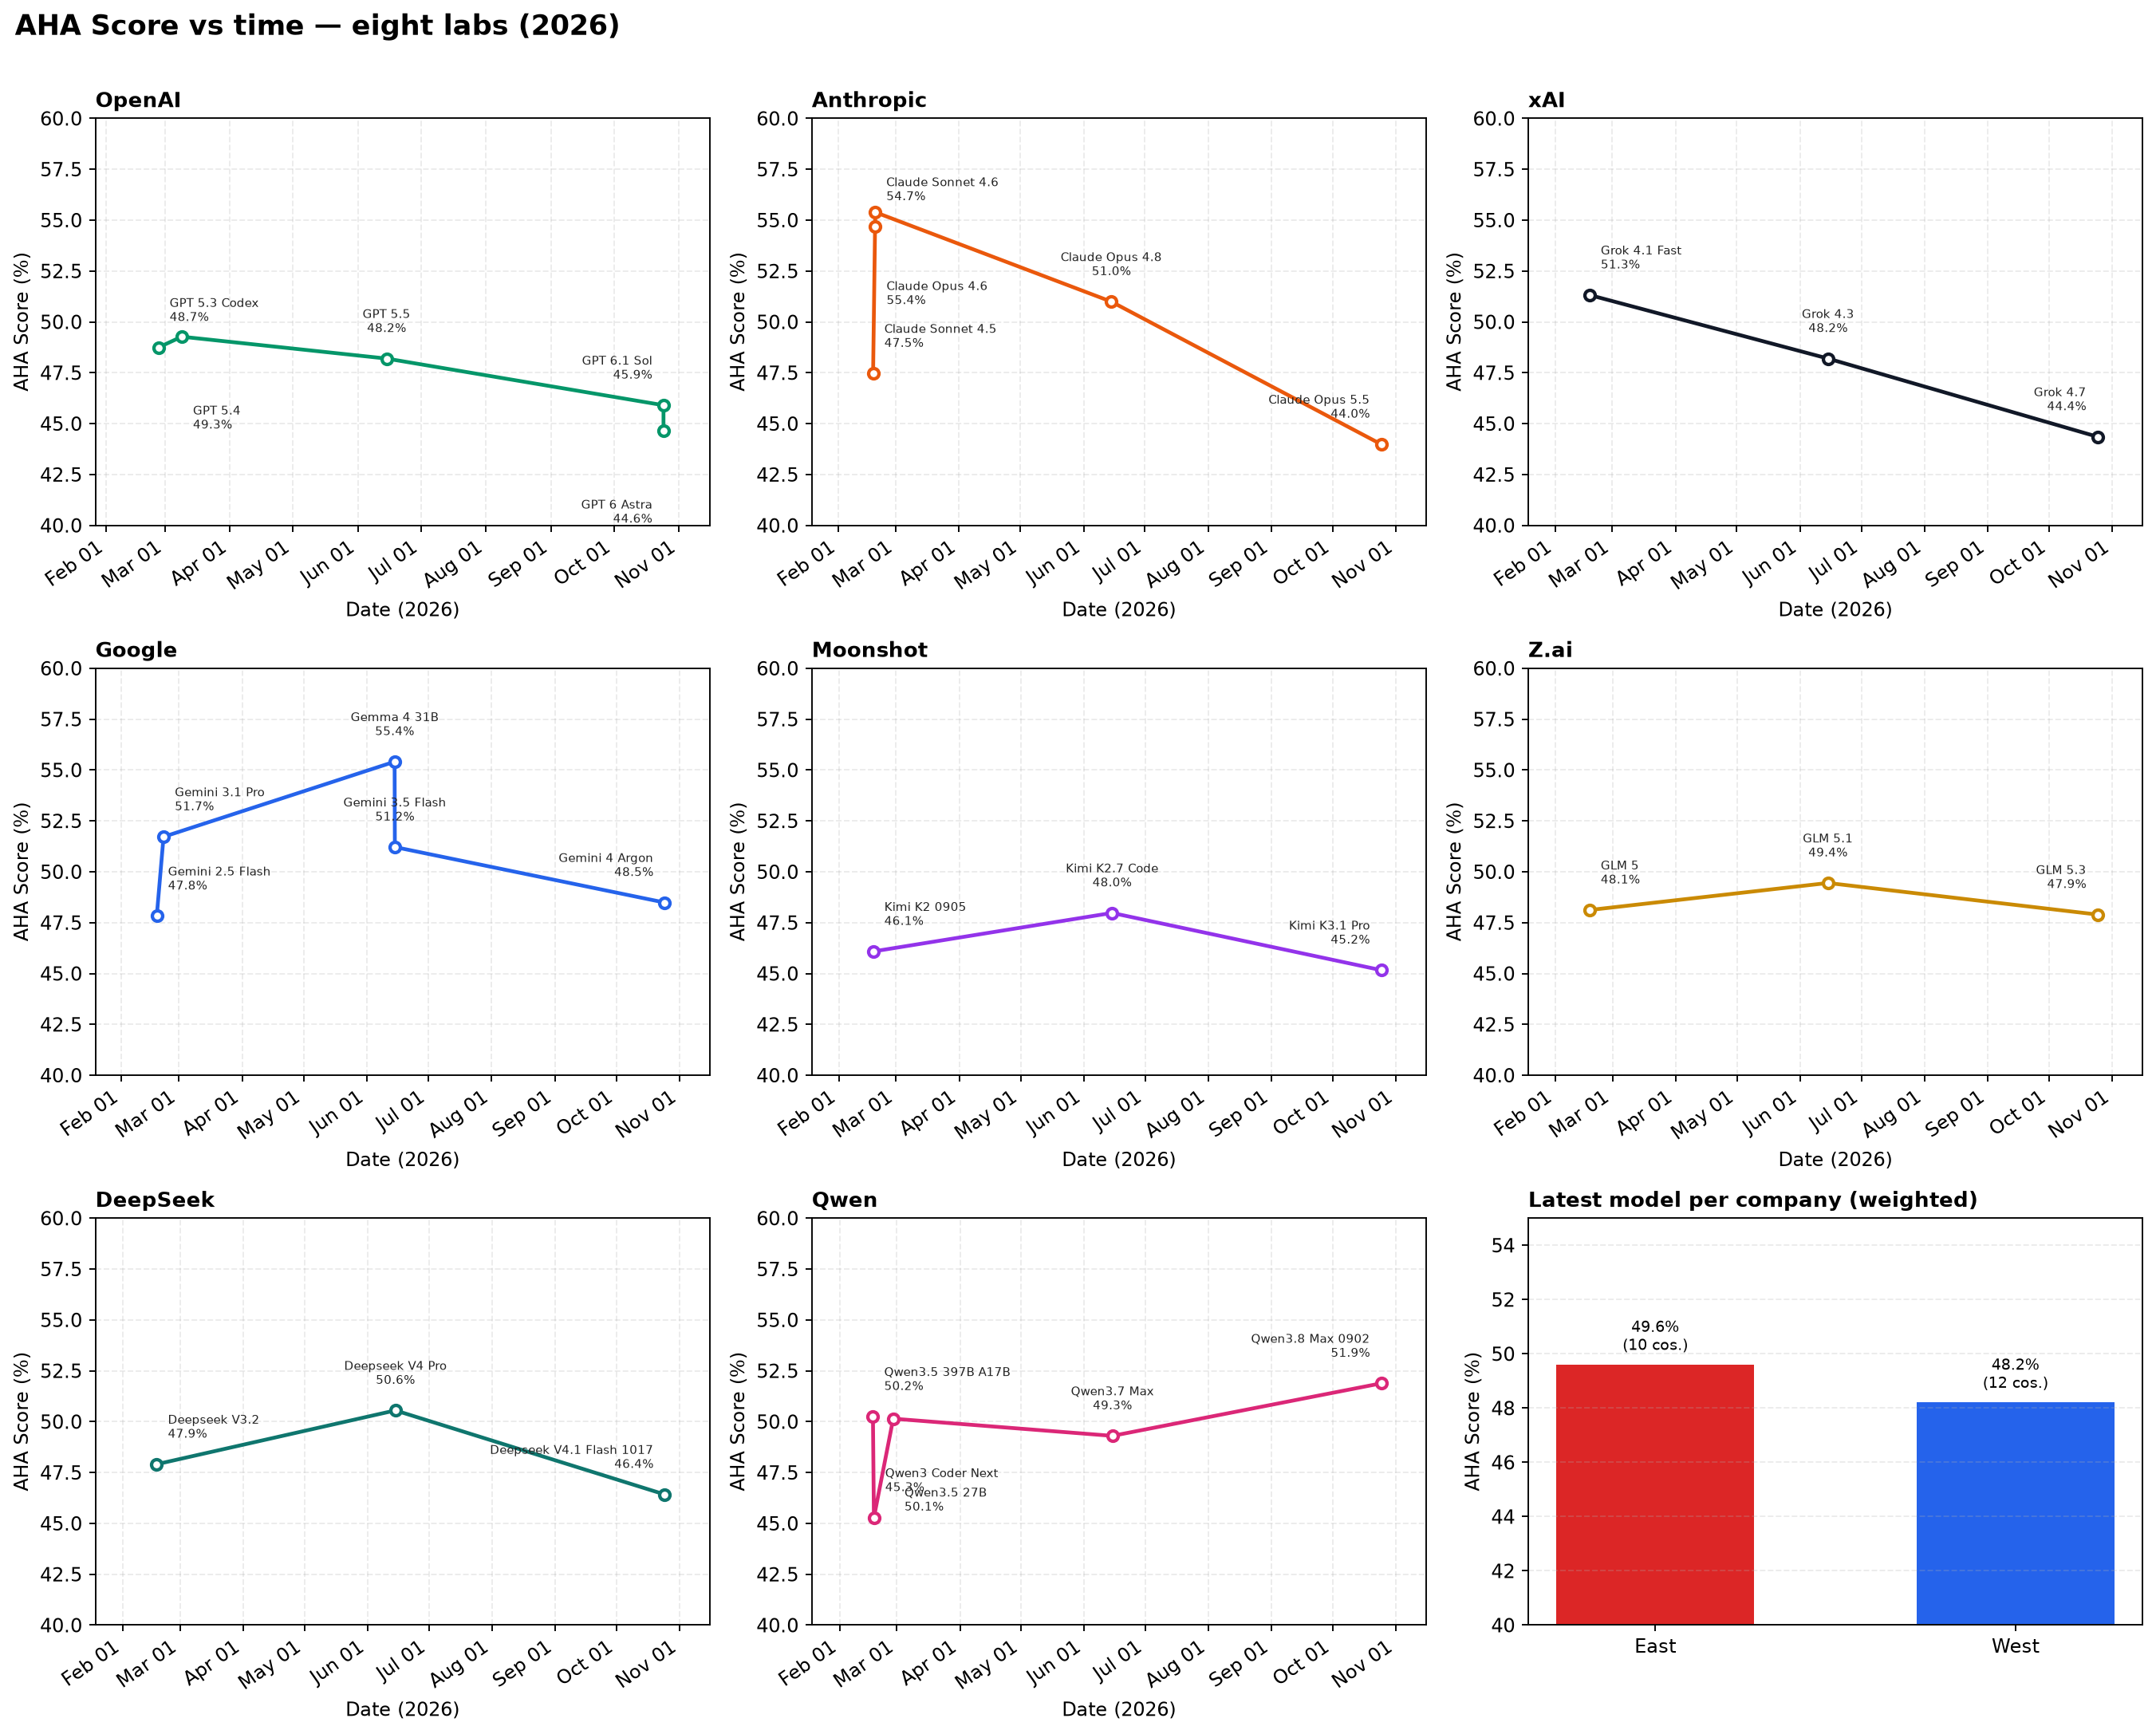
Looking only within companies, NVIDIA improved the most: Nemotron 3 Super 43.9% to Nemotron 3.5 Super VL 53.1% (+9.3 points). Inception improved 6.8 points and Mistral 6.3 points. xAI declined the most (Grok 4.1 Fast 51.3% to Grok 4.7 44.4%, -7.0), followed by InclusionAI (-5.8), OpenAI (-4.1), and Anthropic (-3.5).
Anthropic peaked at Claude Opus 4.6 in February at 55.4%; the newest Claude Opus 5.5 is 44.0%. Google peaked with Gemma 4 31B at 55.4%; Gemini 4 Argon is 48.5%. Six companies — Anthropic, Google, DeepSeek, xAI, Xiaomi, and Z.ai — are now below their own 2026 peak.
East vs West
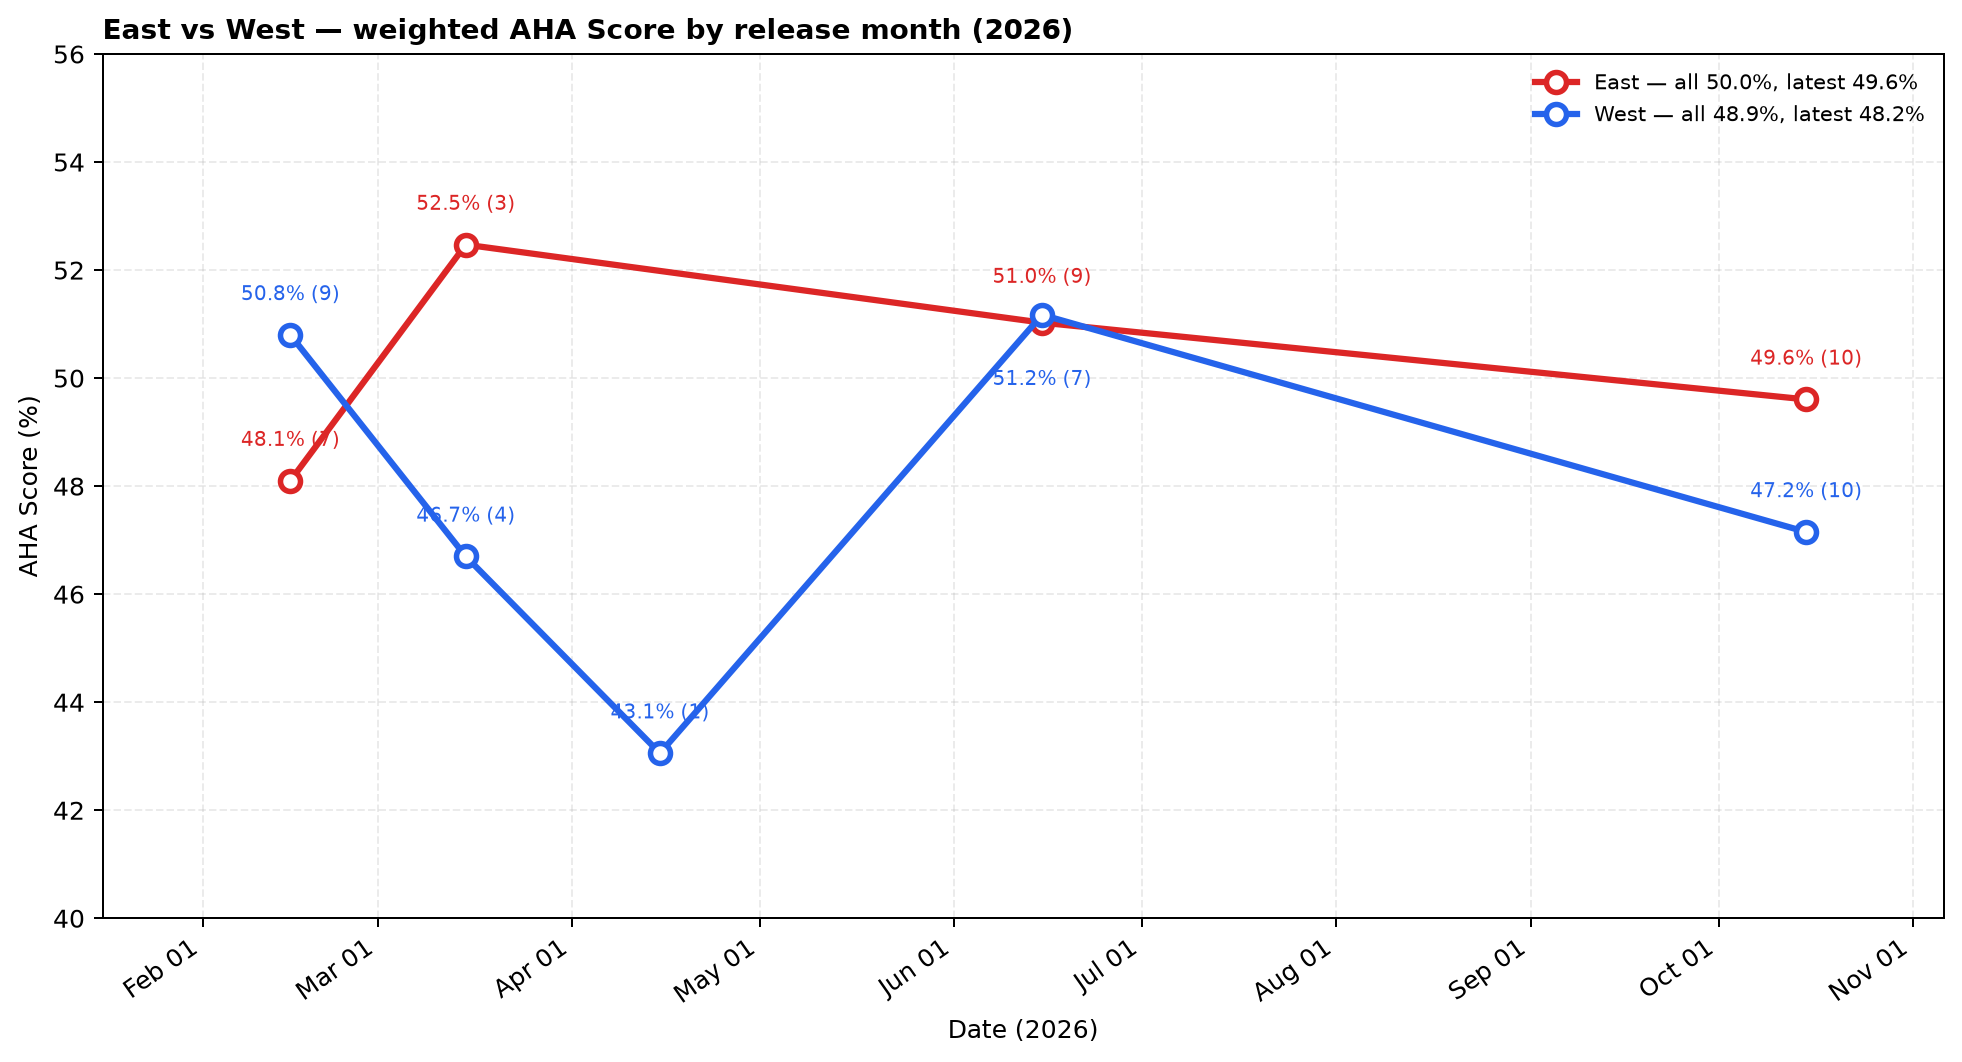
Grouping companies by headquarters, the East is slightly ahead of the West in 2026:
| Comparison | East | West | Edge |
|---|---|---|---|
| All models, weighted | 50.0% | 48.9% | East +1.1 |
| Latest model per company | 49.6% | 48.2% | East +1.4 |
East leaders are Tencent (54.2%), ByteDance Seed (52.6%), and Qwen (51.9%). West leaders are Liquid AI (55.5%), Mistral (54.4%), and NVIDIA (53.1%). The East has the better bloc average, but the two highest latest-model scores are Western.
Eight companies combined
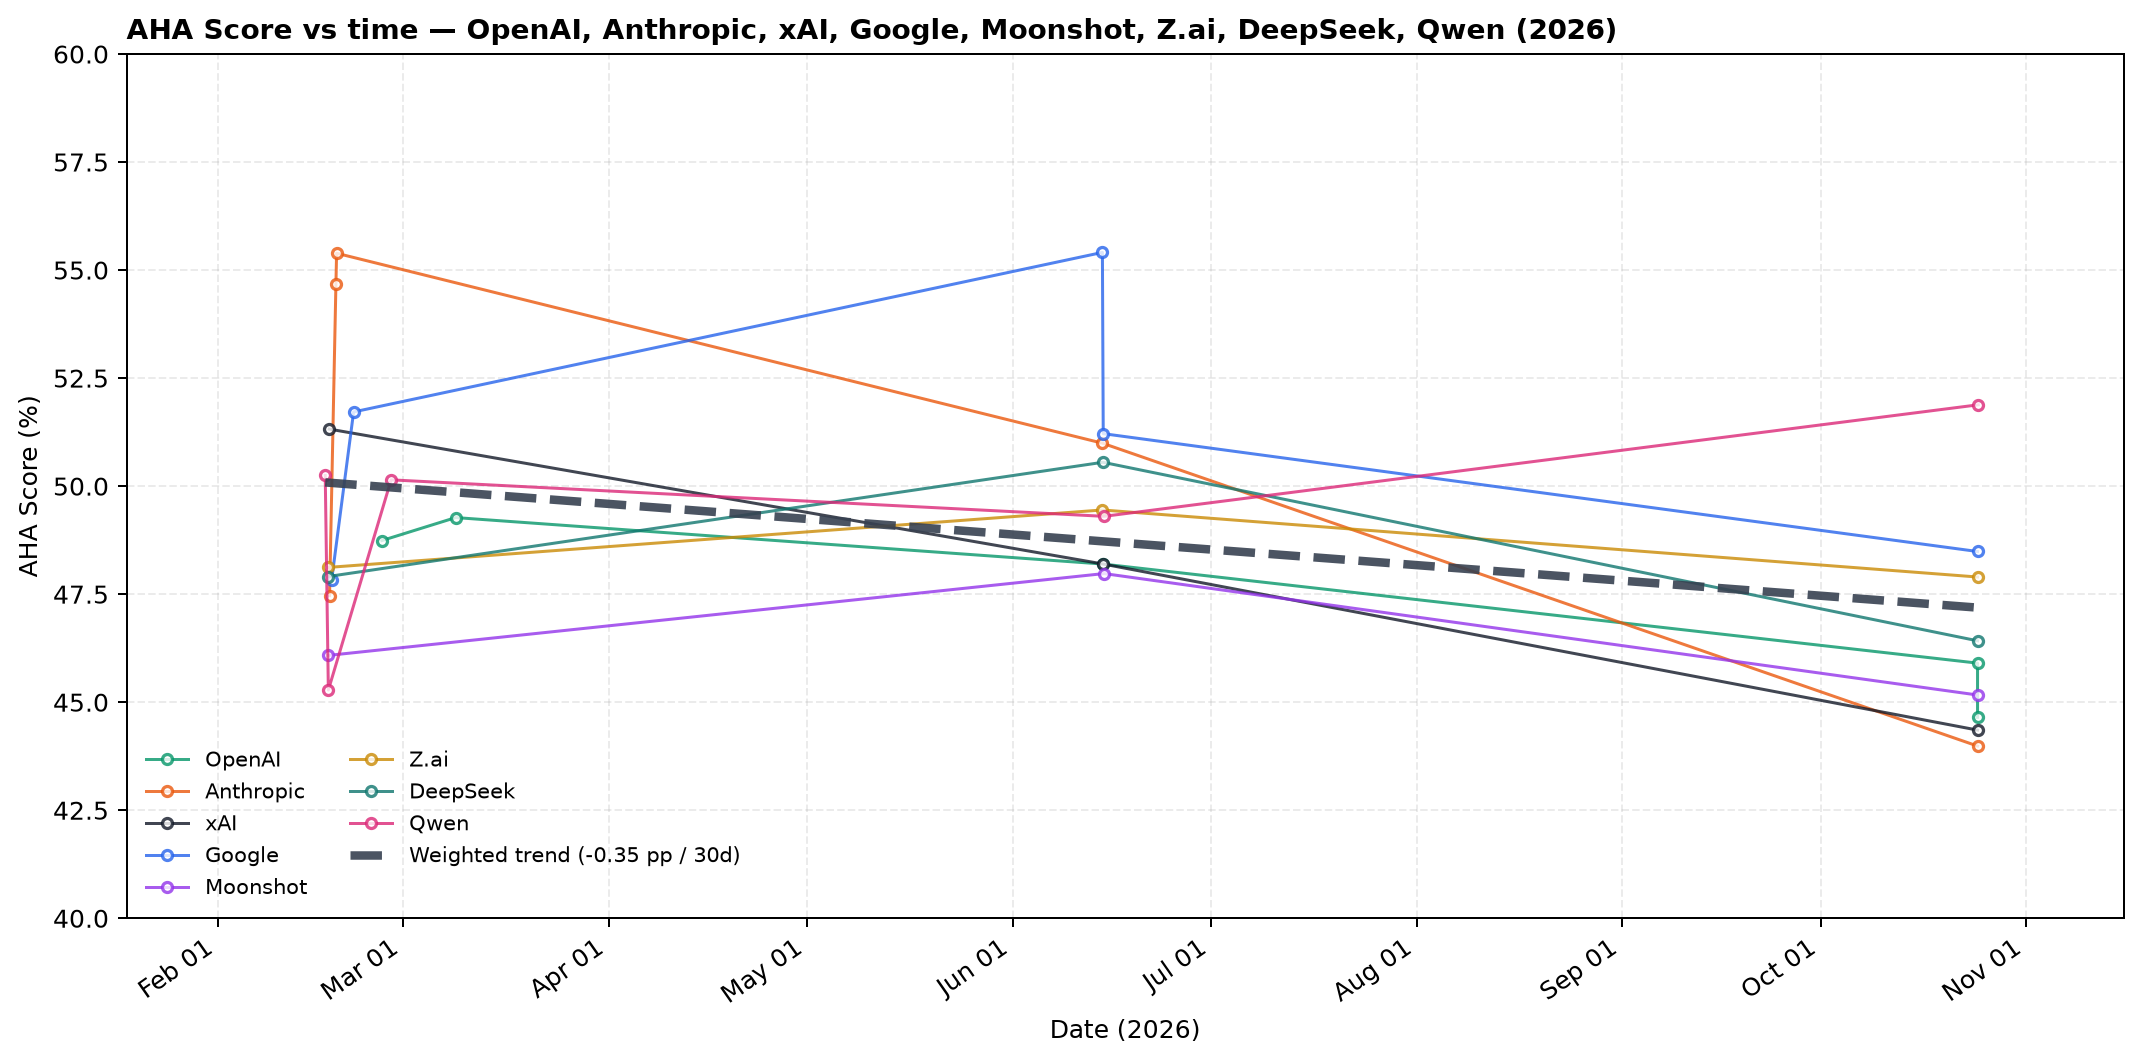
The combined view across OpenAI, Anthropic, xAI, Google, Moonshot, Z.ai, DeepSeek, and Qwen is a mild downtrend. The comparison-weighted trend line is -0.35 AHA points per 30 days. Most labs' newest models sit below their own 2026 peaks, and the eight-company trend follows them down.
Qwen is the exception. Its family trajectory goes from Qwen3.5 397B at 50.2% to Qwen3.8 Max at 51.9%, and the newest point sits above the weighted trend line. It is moving upwards while the combined trend is going down. The Qwen result used a minimal reasoning profile; without it, the model looped and produced mostly invalid JSON.
p(doom) moved up
The public p(doom) page fits a linear trend to AHA Score over time and maps the latest trend value through p(doom) = 0.5104 − 0.0066 × trend score. Lower is better.
| Snapshot | Models | Trend score | Slope | p(doom) |
|---|---|---|---|---|
| Before today, through 2026-06-14 | 40 | 50.4 | +0.45 pts/month | 0.177 |
| Now, through 2026-10-24 | 60 | 48.4 | -0.13 pts/month | 0.191 |
| Old trend extrapolated to 2026-10-24 | 40 | 52.4 | – | 0.164 |
The 20 new models averaged 48.4%, versus 50.0% for the 40 models already on the board. That pulled the fitted trend down and flipped its slope from positive to negative. p(doom) rose from 0.177 to 0.191, an increase of 0.014. Against the old trend's extrapolation, it is 0.027 higher.
In plain terms: the earlier 2026 improvement did not continue. The newest models were, on average, less aligned with the ground truth than the board's existing mix, and p(doom) moved the wrong way.
Method and caveats
- AHA Score = matches / comparisons against ground-truth sessions. Score = matches − mismatches. Comparison counts vary from 1,352 to 1,409 per model.
- 60 distinct models, measured 2026-02-17 through 2026-10-24.
- The comparison LLM is Qwen3-30B-A3B-Instruct-2507, Q4_K_XL, served locally with llama.cpp.
- 20 new models were added today: 19 evaluated normally plus Qwen3.8 Max with
reasoning_effort=minimal. Mistral Large 4.0 and Sakana Fugu Ultra v2 were excluded after smoke tests. - p(doom) is a linear extrapolation of leaderboard scores, not a forecast. It is sensitive to model mix, comparison counts, and the choice of ground truth.
The live leaderboard is at pickabrain.ai/aha. The p(doom) page is at pickabrain.ai/aha/2026-p-doom.